
Chrome DevTools is usually the better default for everyday web debugging on a Mac, while Safari Web Inspector is the safer choice for Safari-only bugs, iPhone testing, and WebKit behavior. A front-end developer checking CSS, JavaScript, layout, storage, and network requests will usually move faster in Chrome. A developer testing Apple users cannot skip Safari, because Safari still behaves differently in small but painful ways.
TLDR: Chrome DevTools gives broader tooling, clearer panels, and faster daily debugging for most web teams. Safari Web Inspector is essential when a bug appears only in Safari or on iOS. For example, a team testing a checkout page may find that 8 out of 10 layout issues are fixed fastest in Chrome, but the last 2 issues may only appear in Safari on an iPhone. In a small QA pass of 50 pages, that split can save hours if both tools are used for the right job.
What Inspect Element Means on Mac
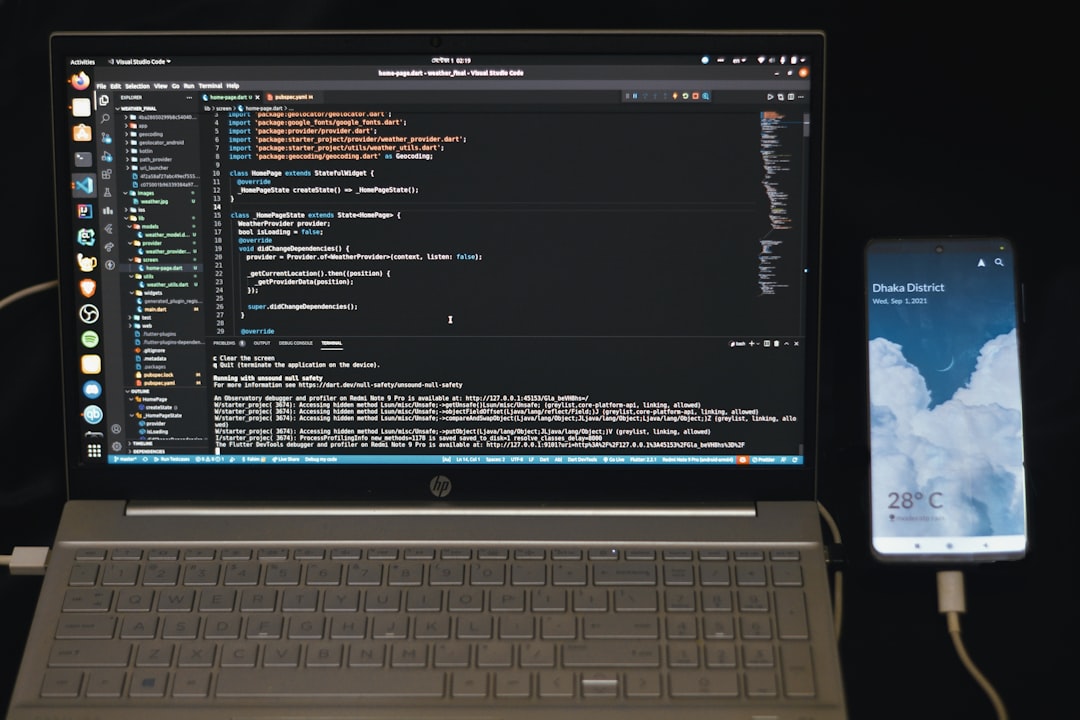
Inspect Element is the browser feature that opens developer tools for a selected part of a web page. On Mac, it lets a developer inspect HTML, edit CSS live, watch JavaScript errors, review requests, test responsive layouts, and study performance problems.
In Chrome, Inspect Element opens Chrome DevTools. In Safari, it opens Safari Web Inspector. Both tools can change a page in real time without editing the source files. Those changes vanish after refresh unless copied into the project code.
Chrome usually enables this feature by default. Safari needs one extra step. The developer must open Safari > Settings > Advanced, then enable Show features for web developers or a similar developer menu option, depending on the macOS and Safari version. Honestly, it feels like Safari hides the front door to its own toolkit.

How to Open Inspect Element
- Chrome: right-click an element and choose Inspect.
- Chrome shortcut: press Command + Option + I.
- Safari: enable the Develop menu first, then right-click and choose Inspect Element.
- Safari shortcut: press Command + Option + I after developer features are enabled.
For both browsers, the inspected element is highlighted in the page. Its HTML appears in one panel. Its styles appear in another. This makes it easy to test a different font size, remove a margin, change a color, or spot a broken class name.
Chrome DevTools: Strengths for Daily Debugging
Chrome DevTools feels more complete for most web debugging work. Its Elements panel is clean. CSS editing is quick. Invalid rules are crossed out clearly. Layout tools for flexbox and grid are strong. Color pickers, spacing overlays, and computed styles are easy to read.
The Console is also strong. It shows JavaScript errors, warnings, logs, failed requests, and source links. For React, Vue, Angular, and other modern stacks, Chrome is often the browser developers check first. Add-ons and framework extensions make the experience even better.
The Network panel is one of Chrome’s biggest wins. It is simple to filter by Fetch, XHR, JS, CSS, images, fonts, and documents. It shows status codes, timing, payloads, headers, cookies, response previews, and cache behavior. A developer can spot a 404 image, a 500 API response, or a slow third-party script in seconds.
Chrome also offers helpful tools for:
- Performance profiling with flame charts and long task reports.
- Lighthouse audits for speed, accessibility, SEO, and best practices.
- Device emulation for screen sizes and network throttling.
- Application storage for cookies, localStorage, sessionStorage, IndexedDB, and service workers.
- CSS debugging with grid overlays, flex guides, and live rule edits.
The catch is that Chrome can make developers too comfortable. A site may look perfect there and still break in Safari. Chrome uses the Blink engine. Safari uses WebKit. That difference matters.
Safari Web Inspector: Strengths for Apple Testing
Safari Web Inspector is not as polished in every area, but it has one clear job: it shows how Safari sees the page. That is critical for Mac, iPhone, and iPad users. If a layout bug happens only in Safari, Chrome DevTools cannot fully prove the fix.
Safari is especially useful for testing:
- WebKit CSS behavior, including sticky positioning, transforms, and overflow issues.
- iOS Safari bugs, such as viewport height problems and input zoom quirks.
- Touch behavior for mobile menus, carousels, and forms.
- Apple privacy features that affect cookies, tracking scripts, and storage.
- Media playback rules for autoplay, inline video, and audio controls.
The biggest advantage is remote inspection. A developer can connect an iPhone to a Mac with a cable, open Safari on the phone, and inspect the live mobile page from Safari on macOS. This is often the fastest way to solve iOS-only bugs. It drives people mad that a bug can hide on desktop Safari yet appear instantly on a real iPhone, but that is common.
Chrome vs Safari: Key Differences
| Feature | Chrome DevTools | Safari Web Inspector |
|---|---|---|
| Best use | General debugging and performance checks | Safari, iOS, and WebKit testing |
| Ease of access | Ready by default | Developer menu must be enabled |
| CSS tools | Very strong, clear visual helpers | Good, but less friendly |
| Mobile testing | Good emulation | Best for real iPhone Safari inspection |
| Performance audits | Lighthouse and detailed profiling | Useful timelines, fewer built-in audits |
Which Tool Should a Developer Use First?
For most work, Chrome should come first. It is faster for layout checks, JavaScript errors, API failures, storage testing, and performance reports. The interface is easier to scan, and the tooling suits modern development workflows.
Safari should come second, not last. Once a feature works in Chrome, it should be tested in Safari before release. If the site has many mobile users, Safari testing deserves even more attention. On some consumer sites, iOS Safari may represent 40% to 60% of mobile traffic. Ignoring it can turn a small bug into lost sales.
A practical workflow looks like this:
- Inspect and fix the issue in Chrome DevTools.
- Check layout and console errors in Safari Web Inspector.
- Test responsive states in both browsers.
- Use a real iPhone for checkout, login, menu, video, and form testing.
- Copy any live CSS changes back into the source files.
Common Annoyances
Chrome can feel heavy. With many tabs open, DevTools may eat memory and slow the machine. Performance recordings can also overwhelm newer developers with too much data at once.
Safari has different annoyances. The developer tools can feel less obvious. Some panels are harder to read. Remote iPhone inspection may fail until Safari, macOS, iOS, cables, trust settings, and developer options all behave. Expect to waste time on setup at least once.
Best Recommendation
The best choice is not either-or. A developer on Mac should use Chrome DevTools as the main workbench and Safari Web Inspector as the Apple reality check. Chrome helps find and fix most problems quickly. Safari confirms that the site works for people using Safari on Mac, iPhone, and iPad.
That mix gives better coverage with less guesswork. It also prevents the classic mistake: shipping a page that only works well in the browser used during development.
FAQ
Is Inspect Element available on every Mac?
Yes. It is available through browsers such as Chrome and Safari. Chrome exposes it by default. Safari requires developer features to be enabled in settings.
Is Chrome DevTools better than Safari Web Inspector?
For general debugging, yes. Chrome DevTools is usually faster and richer. Safari Web Inspector is better for Safari-specific and iOS-specific issues.
Can Safari inspect an iPhone website?
Yes. A developer can connect an iPhone to a Mac and inspect Safari pages through Safari Web Inspector. This is one of Safari’s strongest features.
Do Inspect Element changes save automatically?
No. Live edits in DevTools or Web Inspector are temporary. They disappear after refresh unless the developer copies the changes into the project files.
Should developers test in both Chrome and Safari?
Yes. Chrome is great for speed and tooling. Safari is required for WebKit and iOS accuracy. Testing both reduces browser-specific bugs.