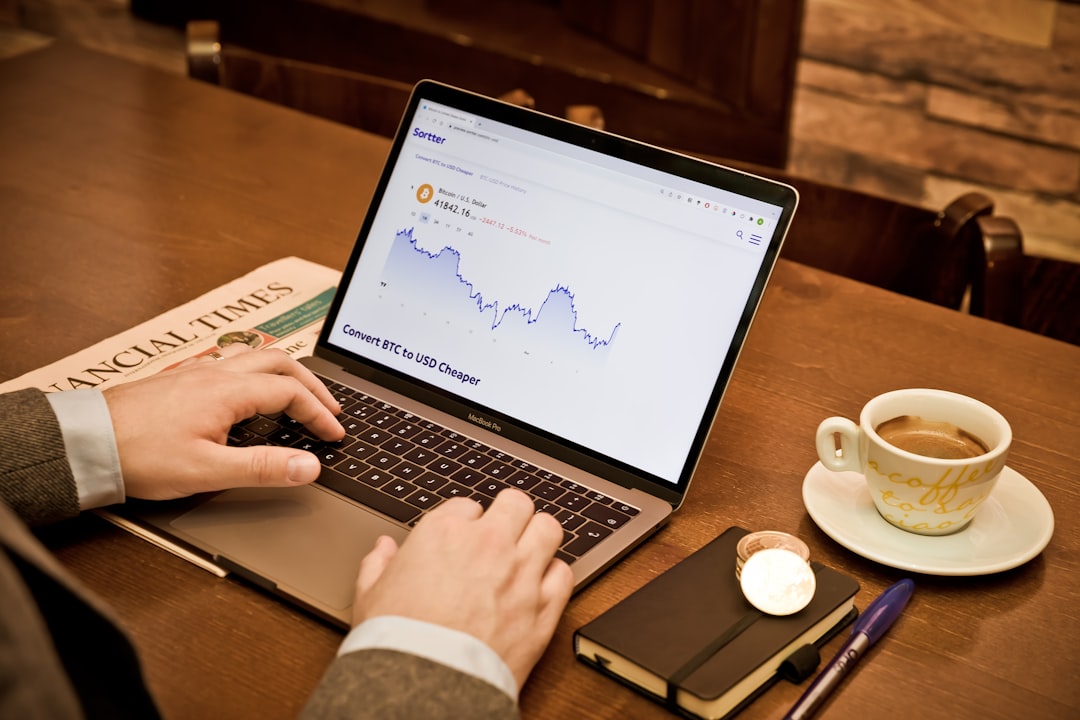
Running an online store is exciting. But how do you know if your store is doing well? That’s where e-store analytics come in. They help you understand what’s going on behind the scenes. Don’t worry—it’s not as hard as it sounds. Let’s break it down and make it fun!
Why Use E-Store Analytics?
Imagine opening a shop and blindfolding yourself. Sounds silly, right? That’s what running a store without analytics is like. Analytics show you how shoppers behave online. They help you make smart decisions and grow your store.
Start with the Basics
You don’t need fancy tools to get started. Most platforms like Shopify, WooCommerce, and BigCommerce come with built-in dashboards. You can also use Google Analytics. These tools track what matters most.
Here are a few key things to look at:
- Traffic: How many people visit your store?
- Conversion rate: How many of those visitors buy something?
- Bounce rate: How many visitors leave without doing anything?
- Top products: What items are selling the most?
Follow the Customer Journey
Analytics help you see your website through your customer’s eyes. You can follow their journey from start to checkout.
Ask questions like:
- Where do they land on your site?
- What pages do they visit most?
- Where do they drop off?
If many people leave on the checkout page, maybe your process is too long. If a product page gets lots of visits but no sales, the price or pictures might need updating.

Get to Know Your Audience
Knowing who shops at your store is gold. Analytics show details like:
- Age
- Location
- Device type (mobile, tablet, desktop)
- New vs. returning visitors
With this info, you can create ads and content that speak directly to your shoppers.
Pay Attention to Sales and Revenue Trends
Which days of the week bring in the most sales? Is there a spike during the holidays? Are people buying more when there’s a sale banner?
Look for patterns! They help you understand when and why people shop.

Use Heatmaps
Heatmaps are fun! They show where people click, scroll, or stop on your pages.
Are people clicking on a button that doesn’t work? Fix it. Are they skipping your best product? Move it to a better spot. Heatmaps show what’s hot and what’s not.
Test and Improve
Analytics aren’t just for knowing what’s happening. They help you experiment too! Try out two versions of a product page and see which one performs better. This is called A/B testing.
Use tools like:
- Google Optimize
- Optimizely
- VWO (Visual Website Optimizer)
Your store is like a science project. Test, observe, repeat.
Actionable Tips for Better Analysis
- Check your dashboard weekly: Don’t let info pile up.
- Compare month-to-month: See how you’re growing.
- Set goals: Like increasing traffic by 10% next month.
- Use alerts: Most tools let you set up warnings if something unusual happens.
In Conclusion
E-store analytics help turn guesswork into smart work. They show you what’s working and what’s not. And they help you make better choices, faster. You don’t need to be a tech wizard. With regular check-ins and the right tools, you’ll become a data pro in no time.
So go ahead—open your dashboard and start exploring!
