
Revenue cost is calculated by adding all direct costs required to deliver SaaS revenue, then comparing that total with subscription revenue. For most SaaS teams, the better tool depends on the job: Baremetrics is usually easier for quick founder reporting, while ChartMogul is stronger for structured subscription analysis and cohort work. SaaS companies often target high gross margins, and OpenView has reported median SaaS gross margins around the high 70% range [source: OpenView].
TLDR: A SaaS company calculates revenue cost by adding hosting, support, payment fees, customer success labor, and other delivery costs, then dividing that number by revenue. If a company earns $100,000 in MRR and has $22,000 in monthly revenue cost, its revenue cost ratio is 22% and gross margin is 78%. Baremetrics works well when the team wants fast MRR, churn, and basic financial visibility. ChartMogul is better when the team needs cleaner segmentation, cohorts, and subscription data checks.
What Revenue Cost Means in SaaS
Revenue cost, often called cost of revenue or COGS, covers the direct cost of serving paying customers. It does not include every expense in the business. That is where many SaaS reports get messy.
A clean SaaS revenue cost calculation usually includes:
- Cloud hosting, storage, bandwidth, and infrastructure monitoring.
- Payment processing fees, such as card fees and failed payment recovery costs.
- Customer support labor tied to existing customers.
- Customer success labor used for onboarding, renewals, and account health.
- Third party data or APIs needed to deliver the product.
- Implementation work, if it is required to activate the customer.
It usually excludes sales salaries, ad spend, product development, executive payroll, office rent, and broad admin costs. Those may matter for profitability, but they do not belong in cost of revenue unless they directly support delivery.

The Core Formula
The basic formula is simple:
Revenue Cost = Hosting + Support + Customer Success + Payment Fees + Delivery Tools + Direct Service Labor
Then the company can calculate:
Revenue Cost Ratio = Revenue Cost ÷ Revenue
Gross Margin = (Revenue − Revenue Cost) ÷ Revenue
For example, a SaaS company with $250,000 in monthly recurring revenue and $60,000 in cost of revenue has a revenue cost ratio of 24%. Its gross margin is 76%. If that ratio rises to 34%, someone needs to inspect hosting usage, support load, discounts, or low-value accounts. The business may still be growing, but the revenue is getting more expensive to serve.
How Baremetrics Helps Calculate Revenue Cost
Baremetrics is often favored by founders and small finance teams that want answers quickly. It connects to billing systems such as Stripe and turns billing data into MRR, churn, LTV, ARPU, and customer metrics. That helps revenue cost analysis because the revenue side becomes clear fast.
The common Baremetrics workflow looks like this:
- Connect the billing source.
- Confirm MRR, upgrades, downgrades, cancellations, and refunds.
- Export or compare monthly revenue data.
- Add direct cost data from accounting, spreadsheets, or finance tools.
- Calculate cost of revenue and gross margin outside the core dashboard if needed.
The catch is that Baremetrics is not a full accounting system. It is great at subscription visibility, but finance teams still need cost categorization from the general ledger. If cloud costs are split across product development and customer delivery, Baremetrics will not magically fix that allocation.
Baremetrics is strongest when a SaaS company has simple billing, a Stripe-heavy setup, and leaders who want fast signals. It can answer questions like: Did MRR rise while margins fell? Are cancellations tied to a costly customer segment? Did failed payments inflate support work?
How ChartMogul Helps Calculate Revenue Cost
ChartMogul is built for subscription analytics with strong data structure. It is useful when SaaS teams need to segment revenue by plan, region, acquisition channel, customer size, or billing system. This matters because revenue cost is rarely equal across all customers.
A ChartMogul workflow may look like this:
- Import subscription and billing data.
- Clean customer records and map plans correctly.
- Segment revenue by plan, cohort, geography, or account type.
- Compare revenue segments against cost pools from accounting.
- Build margin views by segment in a spreadsheet, warehouse, or BI tool.
ChartMogul shines when finance teams need sharper analysis. A self-serve plan may have low support cost and high gross margin. An enterprise plan may bring larger contracts but require onboarding, support calls, and custom work. Without segmentation, the average margin hides the truth.
Honestly, it feels like some tools make this take 30 minutes longer than needed when customer tags are inconsistent. ChartMogul reduces that pain if the team keeps its data model clean.
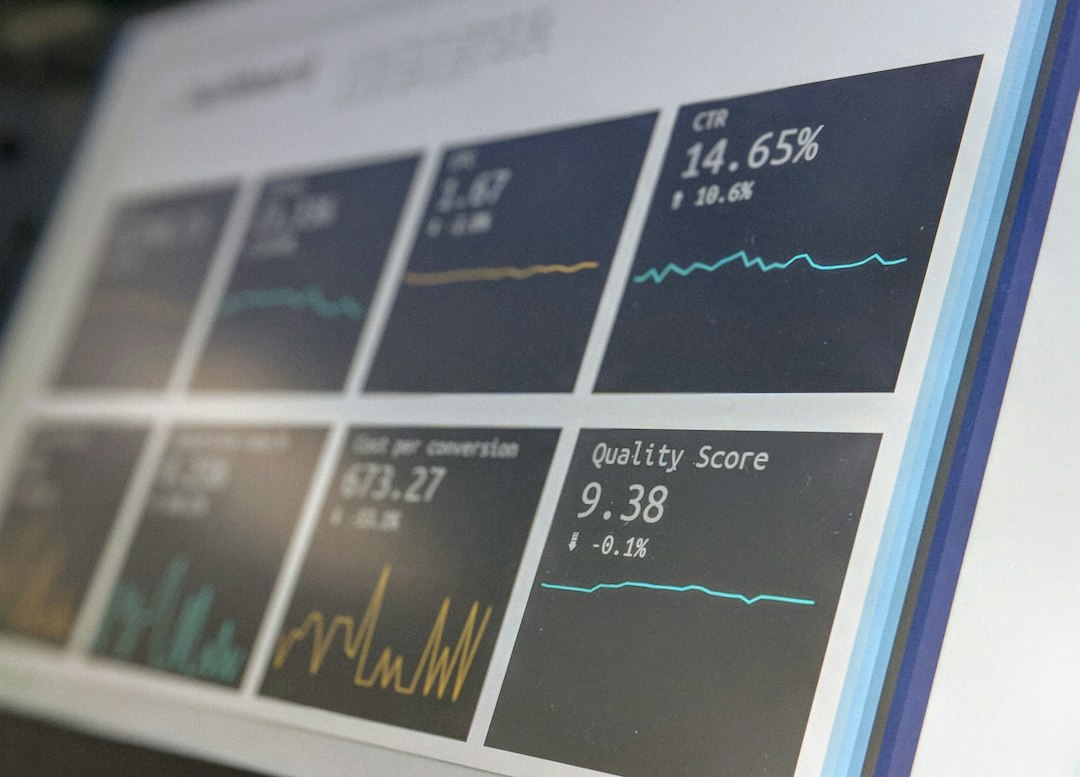
Baremetrics vs. ChartMogul: Which Is Better for Revenue Cost?
Baremetrics is better for speed. It suits companies that need quick subscription metrics and simple reports. It is practical for early-stage SaaS teams that want to pair clear MRR data with a basic cost spreadsheet.
ChartMogul is better for depth. It suits companies with complex subscriptions, several plans, multiple regions, or a finance team that cares about cohort-level margin. It is less about quick founder snapshots and more about clean revenue logic.
| Need | Better Fit |
|---|---|
| Fast MRR and churn monitoring | Baremetrics |
| Segmented revenue analysis | ChartMogul |
| Simple founder dashboard | Baremetrics |
| Cohort and plan comparison | ChartMogul |
| Full cost accounting | Neither alone |
The Best Practical Setup
A SaaS company should not expect either platform to replace accounting. The best setup combines subscription analytics with finance data.
A strong process looks like this:
- Use Baremetrics or ChartMogul for MRR, churn, expansion, contraction, and customer segmentation.
- Use accounting software for expense categories and payroll allocation.
- Create a monthly revenue cost schedule with hosting, support, success, and processing fees.
- Compare margin by segment, not just at company level.
- Review trend changes every month, especially after pricing changes or infrastructure growth.

Common Mistakes to Avoid
The biggest mistake is treating all support and customer success time as the same. Enterprise customers may consume far more service hours than self-serve users. Another mistake is ignoring payment fees. A few percentage points may look small, but they can change margin when volume grows.
Refunds and credits also need careful treatment. They reduce revenue quality and may signal delivery problems. If refunds rise while support costs rise, the company has a margin issue and a product issue.
The final mistake is relying on blended averages. A company can show a healthy 78% gross margin while one customer segment sits at 52%. That segment may still be worth keeping, but the pricing and service model must make sense.
FAQ
What is revenue cost in SaaS?
Revenue cost is the direct cost of delivering software to paying customers. It includes hosting, support, payment fees, customer success, and required delivery tools.
Is revenue cost the same as operating expense?
No. Operating expense includes sales, marketing, product, admin, and other broader costs. Revenue cost only covers costs tied to serving current revenue.
Can Baremetrics calculate revenue cost by itself?
Baremetrics helps with the revenue side, such as MRR and churn. Cost data usually needs to come from accounting records or a finance spreadsheet.
Can ChartMogul calculate gross margin?
ChartMogul can support the revenue and segmentation side of gross margin analysis. The cost side still needs accounting data or a connected reporting process.
Which tool is better for SaaS financial analysis?
Baremetrics is better for fast, simple visibility. ChartMogul is better for deeper subscription analysis, cohorts, and segmented revenue reporting.
What is a healthy SaaS revenue cost ratio?
Many SaaS companies aim to keep revenue cost below 20% to 30% of revenue. The right target depends on market, support model, and customer type.